
Run History, Inspection and Recovery
Follow every workflow execution node by node, then retry, resume or approve runs from a desktop or a phone.
These images are illustrations of the concept, not screenshots of the actual product.
Overview
Every time a FluidGrids workflow executes, it produces a run: a record of which version ran, what started it, how long each node took, what data passed through and what was logged along the way. This concept illustrates the Runs area as the place where a team follows those executions, works out what happened in any one of them, and gets a stalled or failed run moving again without rebuilding the workflow.
Background automations tend to fail quietly. A token expires, an upstream service rejects a request, or a process waits on a decision nobody noticed, and the first sign is often a customer asking why an invoice never arrived. The design answers that by making each run observable down to the individual node, and by placing the recovery actions next to the evidence instead of in a separate tool.
The runs list opens with summary tiles for runs today, success rate, average duration and failures, a filter bar for status, workflow, trigger and date range, and a table in which every row carries a run ID, trigger type, status pill, start time and duration. Opening a completed run shows three panels side by side: an execution timeline of nodes with their timings, the selected node's input and output as JSON, and a timestamped log stream tagged by level and node. A failed run marks the broken node in red, shows a typed error with its message and context, skips the downstream nodes, and offers Retry node, Resume run and Cancel run. A run paused at a wait step shows a Resume run panel where an approver enters a JSON payload and chooses Resume with payload or Reject.
The same run detail is envisioned in the mobile app, where a push notification about a failed workflow opens the run and a single button retries the failing node. Runs sit downstream of the builder and its triggers, rely on stored connections when a credential needs renewing, and feed the analytics and AI diagnosis concepts that look across many runs at once.
What this concept shows
- Summary tiles for runs today, success rate, average duration and failed runs, each compared with the previous day
- Filters for status, workflow, trigger and date range, with a one-click reset
- A runs table with run IDs, trigger types, status pills for completed, running, failed and cancelled runs, start times and durations
- An execution timeline showing each node's status and timing alongside its input and output JSON
- A timestamped log stream tagged INFO, DEBUG, WARN or ERROR and attributed to the node that wrote each entry
- Typed error detail for a failed node, with Retry node, Resume run and Cancel run actions
- Runs that pause at a wait step for human input and resume with a JSON payload, or are rejected
- A mobile run detail opened from a push alert, with a Retry node button
How it works
- Open Runs from the side navigation to see the summary tiles and the table of recent executions.
- Narrow the list by status, workflow, trigger or date range to find the run in question.
- Open a run to follow its execution timeline, select a node, and read its input, output and logs.
- On a failed run, read the typed error and its context, then retry the failing node, resume the run or cancel it.
- On a paused run, enter the approval payload and resume the run, or reject the request.
- Away from the desk, tap a failure notification on a phone to open the run detail and retry the node.
Who it's for
- Operations and automation leads who own business-critical workflows
- Workflow builders debugging a new or changed automation
- On-call engineers responding to failed runs
- Managers and approvers who act on paused approval steps
Illustrations
5 illustrations of this concept. Select one to view it full size.
Runs List With Health Tiles and Filters
The illustration shows the Runs page inside the workspace shell, with Runs highlighted in the left navigation and a plan usage meter at the foot of the sidebar. Four tiles across the top summarize runs today, success rate, average duration and failed runs, each with a small change indicator against the previous day. Below them, a filter bar offers dropdowns for status, workflow and trigger, a date-range picker and a Reset filters button. The table lists sample workflows such as an order-to-cash flow, a lead router and a nightly database sync, each row with a monospaced run ID, a trigger type (webhook, schedule, API or chat), a status pill for completed, running, failed or cancelled, a relative start time sorted newest first, a duration and a row actions menu. The design demonstrates how a team can read run health at a glance and narrow a large volume of executions to the one that matters.
Completed Run With Timeline, Node Data and Logs
This view envisions the detail page of a successful run of a sample order-to-cash workflow, reached through a Back to Runs link. The header shows the workflow name, a Completed badge, a pinned version tag, the webhook trigger, the start time and the total duration, with a Re-run button and a disabled Cancel button on the right. Three panels follow. The execution timeline lists five nodes in order, from the webhook trigger through an order-amount condition, invoice creation and a receipt email to a write into a BigConsole datasink, each with a green check and its duration, and a footer confirming that all nodes completed. The middle panel shows the selected invoice node's input and output as formatted JSON with copy buttons. The logs panel streams timestamped INFO and DEBUG entries, each attributed to the node that wrote it, showing how a run can be audited step by step.
Failed Run With Typed Error and Recovery Actions
Here the design shows a failed run of a sample lead-routing workflow, reached through a breadcrumb from Runs. The header carries a Failed badge, the version, a schedule trigger, the start time and duration, plus a Run actions menu. The node timeline shows three completed steps, a fourth step that posts to a Slack channel outlined in red, and two downstream steps marked Skipped, with a View workflow graph button beneath. The Error detail panel labels the problem as a credential error, states that the Slack token expired with a 401 response, identifies the node, asks the user in plain language to reconnect the Slack connection and shows the error context as JSON. Retry node, Resume run and Cancel run buttons sit below it, with a note that retrying re-executes only that node. The logs panel highlights the error line and offers Download logs, a filter and an auto-scroll toggle.
Paused Run Awaiting an Approval Payload
This illustration shows run control for a sample purchase approval workflow whose amber header badge reads paused and awaiting input. The header gives the start time, notes that the run was triggered through the API and shows its run ID with a copy button, with Cancel run and Pause buttons at the top right. The node timeline shows an HTTP trigger, request validation, a purchase lookup and a risk-scoring step completed with timestamps and durations, then a wait node for manager approval highlighted as waiting for input, followed by pending steps that update a status, notify Slack and end the run. The central Resume run panel names the waiting node and provides a JSON payload editor, here holding an approval flag, with Resume with payload and Reject buttons and a note that the payload becomes the waiting node's input. A live logs panel ends with a warning that the run paused for approval.
Mobile Workflows List and Failed Run Alert
Two phones illustrate the mobile experience envisioned for FluidGrids. The left phone shows a Workflows screen under a workspace switcher, with search and filter icons and cards for sample workflows, each with an Active or Draft badge, its trigger, such as a new order or a daily schedule, and when it last ran. A floating add button and a bottom tab bar for Home, Workflows, Runs, Alerts and Me complete the screen. The right phone shows a push notification reporting that a lead-routing workflow failed, above the Run detail screen it opens. That screen lists the duration, start and finish times and node count, then expandable node rows: four completed steps and a final CRM step marked Failed, with a credential error explaining that the destination service's credentials are invalid or expired. A full-width Retry node button sits at the bottom, so recovery does not have to wait for a laptop.
Topics
- workflow run history
- workflow execution logs
- retry failed workflow node
- resume paused workflow
- human approval step in automation
- workflow run inspector
- node input and output inspection
- automation monitoring
- mobile workflow alerts
- workflow debugging
Related concepts
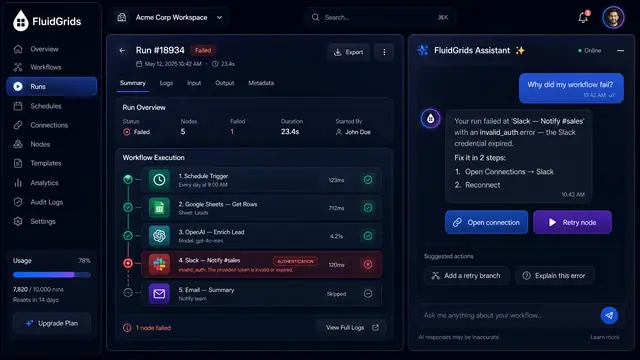
AI Failure Diagnosis and Repair
Ask why a run failed, review an AI-proposed fix as a versioned diff, and let triage group recurring failures into proposals.
3 illustrations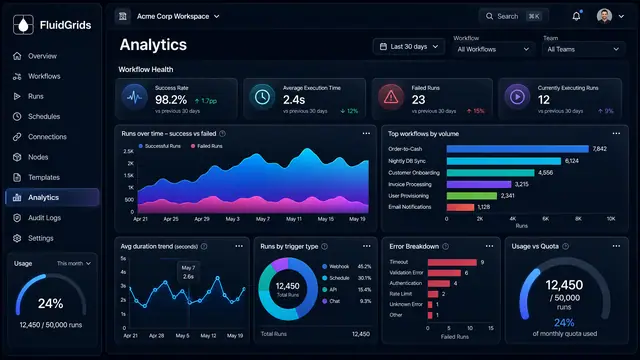
Analytics and Operational Health
Measure success rates, durations, error types and live worker health across every workflow in one place.
3 illustrations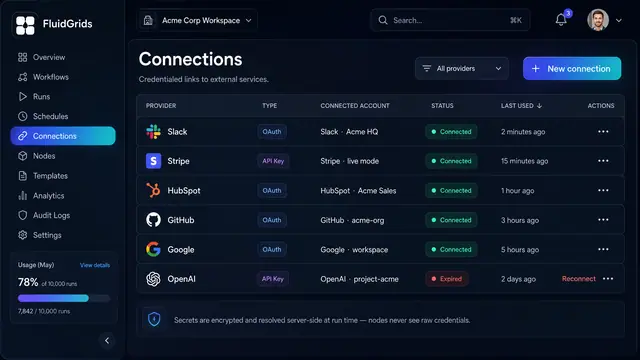
Connections and Credentials
Authorize external services once, reuse them across every workflow, and keep the secrets out of the canvas.
2 illustrations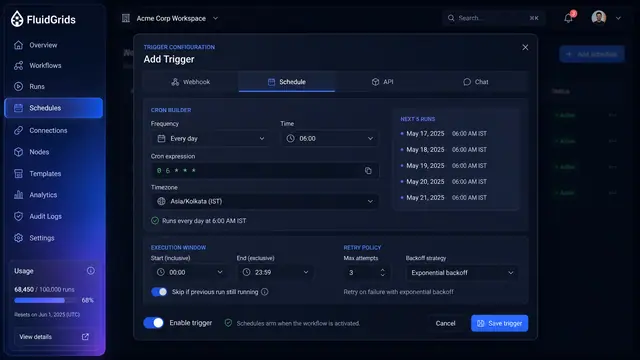
Triggers, Schedules and Webhooks
Decide what starts a workflow — a cron schedule, an incoming request, an API call or a chat message — and keep every trigger under control.
3 illustrations
Part of industry solutions
This concept appears in cross-product solutions on burdenoff.com — see how it works alongside other Burdenoff products to solve a problem in that industry.

Industry solution
Space & Earth Observation
Shows every run of the pass-outcome workflow with its status, so a failed retry or page can be inspected node by node and retried or resumed.
See the solution(opens in a new tab)
Industry solution
Banking & Financial Services
Lists every response playbook run with its trigger, status and duration, so the fraud lead can open the run behind a hold and approve or resume its waiting step.
See the solution(opens in a new tab)
Industry solution
Software & SaaS
Lists every run with its trigger, status and duration, so each support escalation workflow can be followed, retried or recovered.
See the solution(opens in a new tab)
Industry solution
Education & EdTech
Lets registrar and advising staff follow every request the assistant starts, such as a hold review, step by step, and retry, resume or approve it from a desktop or a phone.
See the solution(opens in a new tab)
Industry solution
Veterinary & Animal Health
Every run of the result-matching and callback workflow, with failed runs visible and retryable so a result notice never drops silently.
See the solution(opens in a new tab)
Industry solution
Public Safety & Emergency Services
Every out-of-service notice run recorded step by step, so the fleet shop can see who was told and when, and retry a notice that failed.
See the solution(opens in a new tab)
Industry solution
Medical Devices & Diagnostics
Records each notice, reminder and escalation run node by node, and lets the team retry a send that failed.
See the solution(opens in a new tab)
Industry solution
Data & Analytics
Lists every load run with its trigger, status and duration; a failed run opens node by node so the engineer can fix the mapping and retry only that step.
See the solution(opens in a new tab)
Industry solution
AI & Automation
Follows each run node by node and lets a person resume or retry it from a desktop or a phone, so a held run can be picked up away from a desk.
See the solution(opens in a new tab)
Industry solution
Waste Management & Recycling
The record of each month-end run that carries tickets, tonnage and residue into the diversion ledger, so a failed or missing batch is spotted and retried before the report goes out.
See the solution(opens in a new tab)